
-
Science

SpaceX to Launch Critical U.S. Spy Satellite Mission, NROL-179, from Vandenberg Space Force Base
SpaceX is poised to conduct a pivotal launch for the United States government early Friday morning, June 19, deploying a…
Read More » -
Science

Masters of the Universe: The Artistry Behind Skeletor’s Terrifying Transformation
The much-anticipated cinematic return of He-Man and the Masters of the Universe in director Travis Knight’s ambitious new film has…
Read More » -
Science

Warframe’s Jade Shadows: Constellations Update Continues Ambitious Narrative and Revitalizes Space Combat
Digital Extremes’ enduring free-to-play title, Warframe, continues its remarkable 13-year run by launching the "Jade Shadows: Constellations" update, a significant…
Read More » -
Science

The James Webb Space Telescope Reveals an Exoplanet Experiencing Extreme Temperature Swings, Offering New Insights into Planetary Atmospheres
If you thought summer here on Earth could get pretty brutal, spare a thought for the extrasolar planet, or exoplanet,…
Read More » -
Technology

Review: Disclosure Day is big on action, light on ideas
The eagerly anticipated summer blockbuster season has officially commenced with the theatrical release of Disclosure Day, director Steven Spielberg’s latest…
Read More » -
Science

The Arrival: A 30-Year Retrospective on the Underappreciated Sci-Fi Thriller That Foresaw Our Fascination with the Extraterrestrial
Thirty years ago, on May 31, 1996, Orion Pictures quietly released "The Arrival," a science fiction film that, in retrospect,…
Read More » -
Health & Wellness
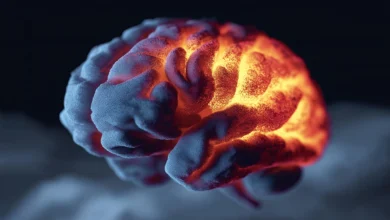
Unlocking Alzheimer’s: Scripps Researchers Identify Key Molecular Switch Driving Chronic Brain Inflammation
The brain, a marvel of biological complexity, possesses its own intricate defense system, a specialized immune network designed to detect…
Read More » -
Politics

Escalating Tensions and Rights Concerns at Newark’s Delaney Hall Immigration Detention Center
For hours, a stark tableau of resistance and authority defined the asphalt strip outside Delaney Hall, Newark’s immigration detention center.…
Read More » -
Technology

The Cynics Are Making Me Cynical: A Deep Dive into the Enduring History of Vaccine Opposition
Dr. Stanley Plotkin, at 93 years old, a towering figure instrumental in the development of numerous life-saving vaccines, recently voiced…
Read More » -
Science

Transformers: The Movie 40th Anniversary 4K Re-release Announced for Theatrical Return
The iconic animated film, "Transformers: The Movie," is set to make a significant return to the big screen, celebrating its…
Read More »
